Renko chart strategies don’t have to be complicated. In fact, one of the reasons I like Renko charts is that they can make it easier to focus on price direction without filling the chart with indicators.
In this guide, I’ll walk through three simple ways I use Renko charts: trendlines, Supertrend, and support and resistance.
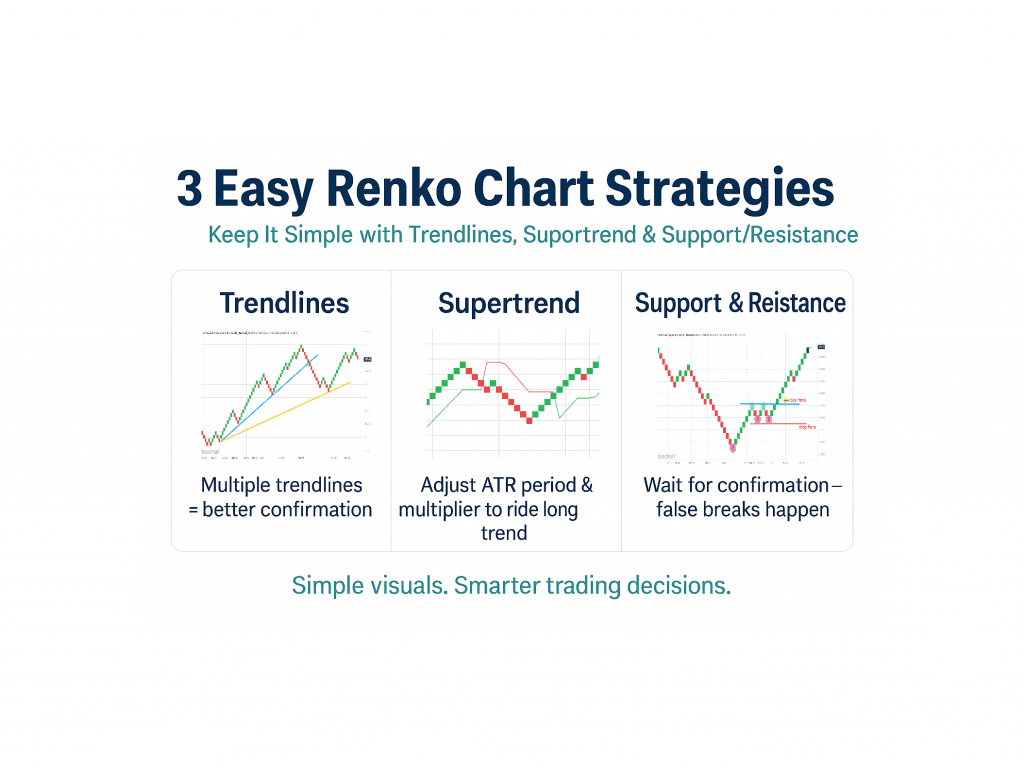
Each method approaches the market differently. Trendlines focus on price structure. Supertrend adds an indicator-based trend filter. Support and resistance focus on areas where price has previously reacted.
The goal isn’t to find a perfect Renko strategy. It’s to start with simple, understandable rules that you can test before adding more complexity.
If you’re completely new to Renko, I recommend reading my Renko Chart Basics guide first. It explains how bricks form, how brick size affects the chart, and how Renko differs from candlesticks.
3 Easy Renko Chart Strategies
| Strategy | What It Helps Identify | Basic Idea |
|---|---|---|
| Renko Trendlines | Trend structure | Use successive swing points to follow the developing trend |
| Renko + Supertrend | Trend direction | Combine Renko structure with Supertrend confirmation |
| Support & Resistance | Potential reaction areas | Watch how Renko behaves around previously important price areas |
Beginner tip: Test one approach at a time. You don’t need all three on the same chart.
Watch: 3 Easy Renko Chart Strategies
This video walks through all three strategies using chart examples. The rest of this guide explains the ideas step by step so you can use the video and article together.
Renko Chart Strategy 1: Follow the Trend With Trendlines
The first strategy is also one of the simplest: draw trendlines directly on the Renko chart.
Because Renko filters smaller price movements, swing highs and lows can sometimes be easier to see than on a busy candlestick chart. Those swing points can be used to create trendlines that help define the direction and structure of a move.
How I Use Renko Trendlines
- Identify a developing sequence of Renko swing highs and lows.
- Connect meaningful swing lows during an uptrend or swing highs during a downtrend.
- Extend the trendline as the Renko trend develops.
- Watch how later pullbacks behave near the line.
- If the original trendline no longer fits the developing structure, evaluate whether a new trendline better represents the broader trend.
One thing I demonstrate in the video is why the first trendline can sometimes be too steep. Early in a strong move, price may accelerate quickly and create a line that doesn’t represent the longer trend very well.
As more Renko bricks develop, a second or third trendline may provide a more useful view of the trend structure.
What Does a Renko Trendline Break Mean?
A trendline break tells me that the previous price structure has changed. It does not automatically mean I should buy, sell, or reverse a position.
Price can break a steep short-term trendline while remaining inside a larger trend. That’s one reason I like comparing more than one meaningful swing structure instead of treating every line break as a trading signal.
You can also combine trendline structure with the entry techniques in my Renko Chart Buy and Sell Signals guide.
Renko Chart Strategy 2: Combine Renko With Supertrend
The second strategy combines Renko price structure with the Supertrend indicator.
Supertrend is based on ATR and a multiplier. Changing those settings changes how responsive the indicator is to price movement.
Rather than assuming there is one perfect Supertrend setting, I think of the settings as variables to test.
| Adjustment | General Effect to Evaluate |
|---|---|
| More responsive setting | Can react to trend changes sooner but may also produce more direction changes |
| Less responsive setting | Can remain with a trend longer but may react later when direction changes |
A Simple Renko + Supertrend Framework
- Identify the current Renko trend.
- Check whether Supertrend agrees with that direction.
- Wait for your predefined Renko entry confirmation.
- Remain with the trend while your continuation conditions remain valid.
- Exit when your predefined Renko, Supertrend, or risk rule is triggered.
The important part is defining the rules before evaluating the results.
For example, entering immediately when Supertrend changes direction is a different strategy from waiting for another Renko brick to confirm the move.
Neither rule is automatically better. They can produce different entry prices, trade counts, drawdowns, and results.
If you want to explore this combination further, see my Renko Supertrend Strategy explained with TradingView examples.
Renko Chart Strategy 3: Support and Resistance
The third strategy uses one of the oldest ideas in technical analysis: support and resistance.
Renko can make these areas visually easier to study because smaller price fluctuations are filtered from the brick structure.
I look for areas where price has repeatedly reacted, stalled, reversed, or broken through in the past.
Using Support in an Uptrend
Suppose Renko is moving upward and then begins pulling back toward an area where price previously found support.
Instead of assuming support will hold, I watch what the Renko bricks do when price reaches that area.
- Identify the support area before price reaches it.
- Allow the pullback to develop.
- Watch for evidence that the decline is losing momentum or reversing.
- Require your normal confirmation before considering an entry.
- Know what price behavior would invalidate the setup.
Using Resistance in a Downtrend
The same concept can be applied in reverse. During a bearish Renko trend, a rally toward previous resistance can become an area to watch for renewed weakness.
The key word is watch. Support and resistance identify areas of interest. They don’t guarantee that price will reverse.
What If Support or Resistance Fails?
This is where a contingency plan matters.
If support breaks, I don’t want to keep treating it as support simply because that’s what I expected. The price structure has changed and the original idea needs to be reevaluated.
The same applies to resistance. A confirmed breakout can change the role of an important price area and potentially create an entirely different setup.
Which Renko Chart Strategy Should You Start With?
If you’re learning Renko, I wouldn’t use all three strategies at once.
| If You Want to Study… | Start With… |
|---|---|
| Pure price structure | Trendlines |
| Indicator-based trend confirmation | Supertrend |
| Important price areas | Support and resistance |
Trendlines are probably the most stripped-down approach because you’re primarily studying the Renko structure itself.
Supertrend is useful if you want an additional objective trend condition. Support and resistance can be useful if your strategy is built around pullbacks, breakouts, or reactions around previous price areas.
Try one, define the rules, and test it before adding another layer.
Brick Size Still Matters With Every Renko Strategy
All three strategies are affected by your Renko brick size.
A smaller brick size generally produces more bricks and more sensitivity to price movement. A larger brick size filters more movement and generally produces fewer bricks.
That means changing brick size can alter:
- where trendline swings appear
- how frequently Supertrend changes direction
- how support and resistance appear on the Renko chart
- the timing of entries and exits
- trade frequency
- historical backtest results
Before deciding a strategy works or doesn’t work, make sure you’re testing the brick-size assumption as carefully as the entry rule.
My ATR-based Renko brick size guide explains one method for selecting values to test, and my free Renko Brick Size Calculator can help generate starting values.
A Simple Renko Strategy Testing Workflow
Whichever of the three strategies you choose, I recommend turning the idea into specific rules before judging it.
- Choose one market. Keep the first experiment focused.
- Choose your Renko brick method and size.
- Define the trend condition. Write down exactly what constitutes an uptrend or downtrend.
- Define the setup. Specify the trendline, Supertrend, or support/resistance condition you’re testing.
- Define the entry. Decide exactly what confirms the trade.
- Define the exit. Decide what ends the trade.
- Define the risk. Determine what invalidates the setup and how position size will be handled.
- Backtest without changing the rules.
- Review the results. Look beyond total return to drawdown, trade count, average trade, and consistency.
This turns a chart idea into something you can actually evaluate.
My Renko strategy backtesting guide walks through this process in more detail.
Common Mistakes With Simple Renko Strategies
- Treating every trendline break as a reversal. A short-term line can break while the larger trend remains intact.
- Searching for perfect Supertrend settings. Settings should be tested across different conditions rather than optimized around one historical move.
- Assuming support or resistance must hold. These are areas to evaluate, not guarantees.
- Changing brick size after every losing trade. Constantly adjusting settings makes meaningful evaluation difficult.
- Adding too many indicators. The point of these strategies is simplicity.
- Ignoring exits and risk. A good-looking entry doesn’t tell you how the entire strategy will perform.
- Skipping backtesting. A setup can look obvious on a completed historical chart and behave very differently when converted into objective rules.
You can find additional examples in my Renko chart mistakes guide.
3 Easy Renko Chart Strategies FAQ
What Is the Easiest Renko Strategy for Beginners?
Trendlines are a good place to start because they allow you to study Renko price structure without requiring another indicator. Supertrend and support/resistance can then be tested as additional approaches once you understand how the bricks behave.
Can I Use Trendlines on Renko Charts?
Yes. Renko swing highs and lows can be used to draw trendlines. A trendline break should be interpreted in the context of the larger price structure rather than automatically treated as a buy or sell signal.
Does Supertrend Work With Renko Charts?
Supertrend can be applied to Renko charts as a trend filter or confirmation tool. Its settings affect how responsive it is, so different combinations should be tested rather than assuming one period and multiplier will work for every market.
How Do You Use Support and Resistance With Renko?
Look for price areas where Renko has previously stalled, reversed, broken out, or repeatedly reacted. When price returns to the area, watch the new brick structure for confirmation rather than assuming the level will automatically hold.
Should I Combine All Three Renko Strategies?
Not necessarily. Start with one approach and test it independently. Combining several methods can add confirmation, but it can also create redundant rules, later entries, and unnecessary complexity.
What Brick Size Should I Use?
There is no universal brick size for these strategies. The appropriate setting depends on the market, volatility, timeframe, and trading rules. Test several reasonable values while keeping the rest of the strategy consistent.
Should I Backtest a Simple Renko Strategy?
Yes. Backtesting helps determine how the rules behaved historically across different market conditions. Renko charts are synthetic, so historical brick construction and simulated execution should also be considered when interpreting the results.
Ready for More Renko Strategies?
These three approaches are intentionally simple. You can use them as individual strategies or as building blocks for more detailed experiments.
Once you’re comfortable defining and testing basic Renko rules, continue with my Advanced Renko Chart Strategies guide, where I explore Supertrend, breakout and retest setups, momentum divergence, moving averages, Fibonacci retracements, and risk management in more detail.
For a broader collection of tutorials, calculators, backtests, and tools, visit my Renko Trading Resources.
Watch More Renko Strategies on YouTube
If you enjoyed these three simple Renko strategies, you’ll find more strategy experiments, backtests, and TradingView tutorials on my Renko Trading Channel on YouTube.
All strategies, settings, indicators, and examples discussed here are educational ideas for experimentation. They are not financial advice or recommendations to buy or sell any security.