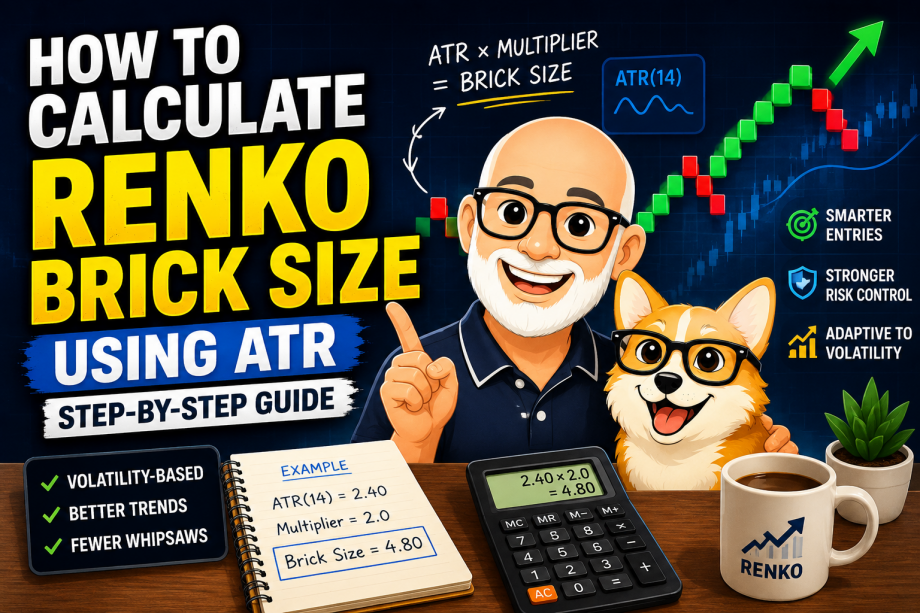
ATR Renko brick size gives you a practical way to choose Renko bricks based on market volatility instead of guessing a fixed dollar, point, or pip value.
When volatility increases, ATR rises and suggests a larger brick size. When the market becomes quieter, ATR falls and suggests a smaller brick size. The goal is to keep the Renko chart responsive without letting every small price movement turn into another brick.
In this guide, I’ll show you how I calculate an ATR-based Renko brick size, how different ATR multipliers change the chart, how to use ATR Renko settings in TradingView, and when I might choose fixed-size bricks instead.
As always, these are ideas for chart analysis and experimentation, not financial advice. There is no single Renko brick size that works best for every market, timeframe, or strategy.
Quick Answer: How Do You Calculate ATR Renko Brick Size?
A simple manual starting formula is:
Renko brick size = ATR × multiplier
- Choose the timeframe you want to analyze.
- Add ATR to that same timeframe.
- Start with a common ATR period such as 14.
- Note the current ATR value.
- Test multipliers such as 1.5, 2.0, and 2.5.
- Round the result to a practical price increment.
- Compare the resulting Renko charts before choosing a setting.
Example: If ATR is 2.00 and you use a 2.0 multiplier, your starting Renko brick size would be 4.00.
Want to automate the math? Try my free Renko Brick Size Calculator in Google Sheets.
Table of Contents
- What Is Renko Brick Size?
- Why Use ATR for Renko Brick Size?
- How to Calculate ATR Renko Brick Size
- How to Choose an ATR Multiplier
- ATR Renko Calculation Video Example
- ATR Renko Settings in TradingView
- ATR vs Fixed Renko Brick Size
- How Volatility Changes ATR Brick Size
- ATR Renko Starting Points by Trading Style
- Using ATR Renko With Trendlines
- How to Test Renko Brick Sizes
- Common ATR Renko Mistakes
- ATR Renko FAQ
What Is Renko Brick Size and Why Does It Matter?
Renko charts build bricks from price movement rather than creating a new candle simply because time has passed.
The amount price needs to move before a new brick forms is the Renko brick size.
That setting controls much of what you see on the chart.
- Smaller bricks respond to smaller price movements and usually produce more signals and reversals.
- Larger bricks filter more movement and create cleaner trends, but entries and exits may appear later.
If the brick size is too small, the chart can become noisy and flip direction frequently. If it is too large, important portions of a move can disappear inside a single brick.
This is why brick size is one of the first things I look at when building or backtesting a Renko strategy.
Why Use ATR for Renko Brick Size?
Average True Range, or ATR, measures recent market volatility. Instead of asking, “Should my Renko brick be $1, $2, or $5?” ATR gives us a volatility-based reference point.
If ATR rises, the market is making larger price moves. A larger Renko brick may therefore make sense. If ATR falls, smaller bricks may be enough to represent meaningful price movement.
- Low ATR: Smaller typical price movements and potentially smaller Renko bricks.
- High ATR: Larger typical price movements and potentially larger Renko bricks.
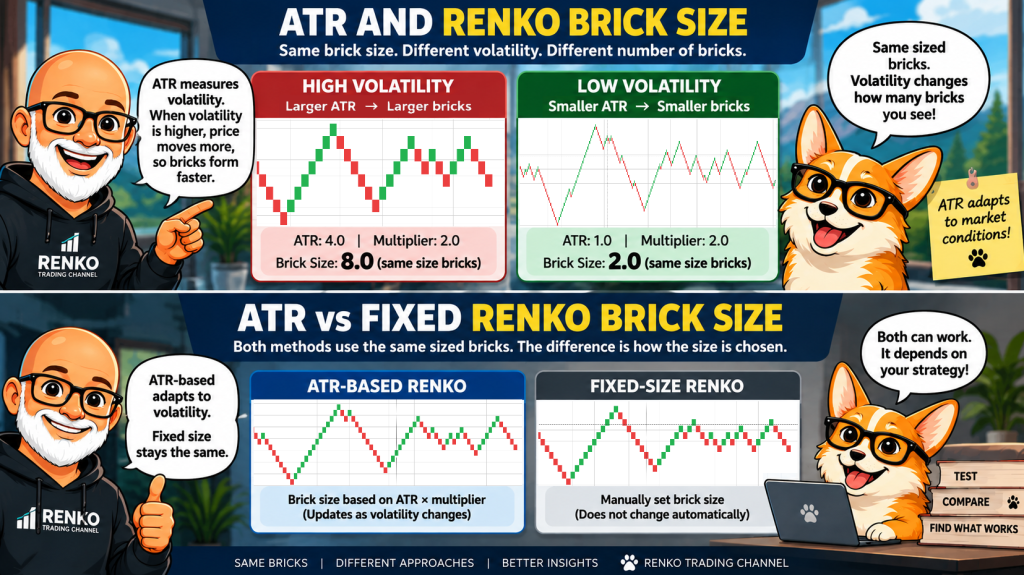
The important point is that ATR gives us a repeatable way to choose a starting value. It doesn’t guarantee that the resulting brick size is optimal for a particular strategy.
ATR-based sizing can be used as a starting framework for stocks, ETFs, futures, forex, and crypto. If you are deciding what type of market you want to test, see my guide to the best markets for Renko charts.
Brick size is only one part of a good Renko setup. Wicks, timeframe selection, confirmation rules, and indicators can also affect how a chart behaves. My best Renko chart settings for TradingView guide goes deeper into those choices.
How to Calculate ATR Renko Brick Size
Here’s the manual method I use when I want ATR to suggest a starting Renko brick size.
- Choose the timeframe. Decide whether you are analyzing a daily, 4-hour, hourly, or another time-based chart.
- Add ATR. I usually start with a 14-period ATR.
- Read the ATR value. For example, assume a stock currently has an ATR of 2.15.
- Choose a multiplier. A useful testing range might be 1.5, 2.0, and 2.5.
- Multiply ATR by the multiplier. With ATR at 2.15 and a multiplier of 2.0, the result is 4.30.
- Round if necessary. Use a practical price increment that your charting platform accepts.
- Apply the brick size. Enter the value as a fixed Renko brick size and inspect how it handles recent price movement.
The formula is:
ATR Renko brick size = ATR × multiplier
ATR Renko Brick Size Example
Suppose a stock has a 14-period ATR of 2.00.
| ATR | Multiplier | Calculated Brick Size | General Effect |
|---|---|---|---|
| 2.00 | 1.5 | 3.00 | More responsive |
| 2.00 | 2.0 | 4.00 | Middle starting point |
| 2.00 | 2.5 | 5.00 | More filtering |
| 2.00 | 3.0 | 6.00 | Slower, broader trends |
With the 2.0 multiplier:
2.00 × 2.0 = 4.00
That gives us a $4 starting brick size to test.
I emphasize “starting” because the formula does not tell us whether $4 produces the best entries, exits, drawdown, or overall strategy performance. That’s what the testing process is for.
You can also automate these calculations with my free Google Sheets Renko Brick Size Calculator, which calculates multiple ATR-based values side by side.
How to Choose an ATR Multiplier for Renko Bricks
The ATR multiplier determines how much volatility you want each Renko brick to represent.
There is no universally correct multiplier, but a small testing range makes the process manageable.
| Multiplier | What You May See | Tradeoff |
|---|---|---|
| 1.0 to 1.5 | More bricks and quicker reversals | More responsive but potentially noisier |
| 2.0 | More filtering than 1.5 | Useful middle ground for testing |
| 2.5 to 3.0 | Fewer bricks and longer visual trends | More filtering but later signals |
| Above 3.0 | Very broad price filtering | May miss shorter moves |
Instead of asking which multiplier is “best,” I prefer asking which one best matches the strategy I’m testing.
If I’m studying longer trends, a larger multiplier may make sense. If I’m studying shorter movements, I may want to test something more responsive.
The key is to change one variable at a time. Testing 1.5, 2.0, and 2.5 while keeping the timeframe, symbol, entry rules, and exit rules unchanged gives you a much cleaner comparison.
ATR Renko Brick Size Calculation Video Example
If you prefer to see the process instead of only reading the formula, this video walks through an ATR-based Renko brick-size example using Barchart.com.
The charting platform can change, but the basic idea is the same: measure volatility, choose a method for converting that volatility into a Renko brick size, and then test the result on the market you actually want to trade or analyze.
If you’re using Thinkorswim, see my Renko Charts in Thinkorswim setup guide.
How to Set ATR-Based Renko Charts in TradingView
TradingView gives you more than one way to approach Renko brick sizing. One important distinction is whether you want TradingView to calculate an ATR-based box size automatically or whether you want to calculate an ATR-based value yourself and enter it as a fixed brick size.
Method 1: TradingView ATR Renko
- Open the symbol you want to analyze.
- Select the timeframe you want to use as your reference.
- Change the chart type to Renko.
- Open the Renko chart settings.
- Select the ATR brick-sizing method when available.
- Choose the ATR length you want to test.
- Review how the resulting bricks behave during different volatility conditions.
With this approach, the platform is using ATR as part of the Renko brick construction process. The available controls can vary by platform and chart configuration.
Method 2: Calculate ATR, Then Use a Fixed Brick Size
This is the method I prefer when I want to compare different brick sizes more systematically.
- Measure ATR on the timeframe you’re studying.
- Multiply ATR by the multiplier you want to test.
- Round the result to a practical number.
- Enter that value as a fixed Renko brick size.
- Keep the brick size unchanged for that particular test.
For example, if ATR is 2.00, I might compare fixed Renko brick sizes of 3.00, 4.00, and 5.00 based on 1.5×, 2×, and 2.5× ATR.
That gives me a controlled experiment because I know exactly which brick size each test used.
If you’re setting up Renko in TradingView for the first time, see my complete guide to the best Renko chart settings for TradingView.
ATR vs Fixed Renko Brick Size: Which Is Better?
Neither method is automatically better. They solve different problems.
| Method | Advantages | Limitations |
|---|---|---|
| Fixed Renko brick size | Simple, consistent parameter, easier to compare in controlled tests | Does not automatically adapt when volatility changes |
| ATR-based Renko | Responds to changing volatility | Brick sizing changes as volatility changes, making some comparisons less controlled |
| ATR-derived fixed size | Uses volatility to choose a starting value while keeping the test parameter fixed | Needs periodic recalculation if you want the starting value to reflect newer volatility |
For visual chart analysis, I like the idea of ATR adapting to changing market conditions.
For strategy experiments, I often prefer using ATR to choose a fixed brick size and then keeping that number unchanged during the test. That makes it easier to compare one configuration with another.
If you want a deeper comparison, see my ATR vs Fixed Size Renko comparison.
How ATR Renko Brick Size Reacts to Market Volatility
This is the main reason traders use ATR for Renko brick sizing.
Imagine a stock that normally moves $2 per day suddenly begins moving $6 or $7 per day. A fixed $1 Renko brick that previously looked reasonable may now produce far more bricks and reversals.
ATR responds to that increase in volatility.
- Volatility increases: ATR rises, suggesting larger bricks.
- Volatility decreases: ATR falls, suggesting smaller bricks.
This doesn’t mean the Renko chart automatically becomes “better.” It means the brick-size calculation is being tied to the scale of recent price movement instead of an arbitrary number.
The same concept becomes important when comparing different symbols. A $2 brick might be enormous for one stock and almost meaningless for another. ATR gives us a way to normalize our starting point around each symbol’s own volatility.
ATR Renko Brick Size Starting Points by Trading Style
The following ranges are not trading rules. They’re simply values you can include in an experiment when deciding how much price movement you want to filter.
| Style | ATR Multiplier Range to Test | What You’re Testing For |
|---|---|---|
| Intraday / shorter-term | 1.0 to 2.0 | More responsive price structure |
| Swing trading | 1.5 to 3.0 | Balance between responsiveness and filtering |
| Longer-term trend analysis | 2.0 to 4.0+ | Focus on larger directional moves |
| Highly volatile markets | Test several values | Determine how much volatility must be filtered |
I would not assume that crypto automatically needs a certain multiplier or that swing trading always requires 2× ATR. The symbol, timeframe, execution rules, and market environment all matter.
If you’re trying to decide on a brick size beyond the ATR formula itself, read How to Choose the Best Renko Brick Size for Your Strategy.
Using ATR Renko Brick Size With Trendlines
Once I have a brick size that produces a useful chart structure, I often like to keep the rest of the chart simple.
Trendlines are one option because Renko can make swing highs and swing lows visually easier to identify.
- Draw rising trendlines beneath Renko swing lows during an uptrend.
- Draw falling trendlines above Renko swing highs during a downtrend.
- Watch for a confirmed break in the existing structure.
- Compare those breaks with your predefined entry or exit rules.
The brick size still matters. A very small brick can create many short-lived trendline breaks, while a very large brick can delay the structural change.
If exits are part of what you’re testing, see my 5 Renko exit rules and Renko chart exit rules.
How to Test Different Renko Brick Sizes
Calculating the brick size is the easy part. The real question is whether that brick size improves the behavior of the strategy you’re testing.
Here’s how I would structure the experiment:
- Choose one symbol.
- Choose one historical period.
- Choose one timeframe or data source.
- Calculate the current ATR reference value.
- Create several brick sizes using different multipliers.
- Keep the entry and exit rules identical for each test.
- Compare trade count, return, drawdown, win rate, and average trade.
- Repeat the experiment on another market period or symbol.
For example, if ATR is 2.00, I might run separate tests using brick sizes of 3.00, 4.00, and 5.00.
If the $4 brick performs best in one historical sample, that doesn’t automatically make it the best future setting. I want to know whether the result remains reasonable across other periods and symbols.
For a practical example, see my Renko Brick Size Backtesting in TradingView guide.
You can also compare how timeframe affects the results in my Daily vs 4-Hour EURUSD Renko backtest.
Common ATR Renko Brick Size Mistakes
1. Treating ATR × Multiplier as a Magic Formula
ATR gives you a volatility-based starting point. It does not know your entry rules, exit rules, risk tolerance, or trading objective.
2. Using Different Reference Timeframes Without Realizing It
ATR measured on a daily chart can be dramatically different from ATR measured on a 15-minute chart. Always document which timeframe produced the ATR value you’re using.
3. Changing Too Many Variables at Once
If you change brick size, timeframe, indicators, and strategy rules at the same time, you won’t know what actually changed the result.
4. Over-Optimizing One Historical Period
It’s easy to find a brick size that looks fantastic after you already know what happened. A stronger experiment tests whether the idea remains useful outside the period used to select the setting.
5. Assuming Smaller Bricks Mean Better Entries
Smaller bricks can produce earlier signals, but they also produce more of them. More signals are not automatically better signals.
6. Ignoring Position Size and Risk
Brick size affects how much price movement each brick represents. If your strategy bases entries, stops, or exits on a certain number of bricks, changing the brick size can also change the dollar risk of the setup.
My Renko position sizing guide explores that relationship in more detail.
Free ATR Renko Brick Size Calculator
If you’d rather not calculate several ATR values manually, I built a free Google Sheets calculator that does the work for you.
The Renko Brick Size Calculator can help you generate several volatility-based brick-size ideas side by side so you can test them instead of relying on one number.
I still recommend treating the calculator output as a starting point. The next step is always testing how those values behave with your actual strategy.
ATR Renko Brick Size FAQ
What Is a Good ATR Period for Renko Brick Size?
A 14-period ATR is a common starting point and is what I usually begin with for experiments. Shorter ATR periods respond more quickly to recent volatility, while longer periods smooth the measurement. The best choice depends on the market, timeframe, and strategy being tested.
What ATR Multiplier Should I Use for Renko Bricks?
I like testing a small range such as 1.5, 2.0, and 2.5 rather than assuming one multiplier is best. Lower multipliers create smaller, more responsive bricks. Higher multipliers create larger bricks that filter more price movement.
What Is the ATR Renko Brick Size Formula?
A simple manual calculation is ATR × multiplier. For example, an ATR of 2.00 multiplied by 2 gives a starting Renko brick size of 4.00.
Is ATR Renko Better Than Fixed Brick Size?
Not necessarily. ATR-based sizing adapts to volatility, while a fixed brick size keeps the same value throughout the chart or test. I often use ATR to identify a starting brick size and then use that value as a fixed parameter when I want a more controlled historical comparison.
Does ATR Renko Brick Size Change Over Time?
ATR changes as new price data arrives, so a brick size based directly on ATR can also change as volatility changes. If you manually calculate ATR × multiplier and enter the result as a fixed brick size, that fixed value stays unchanged until you decide to recalculate it.
How Do You Set ATR Renko in TradingView?
Switch the TradingView chart type to Renko, open the Renko settings, and select the ATR-based sizing method when available. You can then adjust the ATR length. Another approach is to calculate your own ATR-based brick size and enter that result as a fixed Renko value for controlled testing.
Can You Use ATR Renko Brick Size for Crypto, Futures, and Forex?
Yes. The same volatility-based idea can be tested on different markets, but the resulting values will be very different because price scale, volatility, tick size, and trading behavior vary from one market to another.
Related Renko Resources
- Free Renko Brick Size Calculator
- How to Choose the Best Renko Brick Size
- Best Renko Chart Settings for TradingView
- Renko Brick Size Backtesting in TradingView
- Renko Brick Size, Wicks & Reversal Confirmation
- ATR vs Fixed Size Renko
- Renko Brick Size for Gold
- Renko Chart Buy and Sell Signals
- Renko Chart Indicators
- Renko Trading Resources
Final Thoughts
I like ATR-based Renko brick sizing because it replaces a completely arbitrary guess with a repeatable volatility-based starting point.
But ATR is only the beginning of the experiment.
A brick size that creates a beautiful chart isn’t necessarily the brick size that produces the best strategy results. I still want to test how the setting affects entries, exits, trade frequency, drawdown, and performance across different market environments.
A simple process works well: calculate a few ATR-based values, test them side by side, keep the rules consistent, and see what the data tells you.
If you want to make that process faster, use my free Google Sheets Renko Brick Size Calculator to generate several ATR-based starting values automatically.
If you’d like to see more Renko experiments, TradingView backtests, and strategy ideas, visit the Renko Trading Channel on YouTube.
All strategies, settings, and calculations discussed here are educational ideas for experimentation. They are not financial advice or recommendations to buy or sell any security.