
Opening hundreds of charts every week is not a trading process. It is a fast way to become distracted by whichever stock happens to look exciting at that moment.
I use a Renko watchlist to narrow the market into a smaller group of charts that deserve my attention. The goal is not to predict which stock will produce the next winning trade. My goal is to create a repeatable process for identifying liquid markets, clean trends, manageable pullbacks, and setups that may eventually meet my entry rules.
In this guide, I will explain how I build my weekly Renko watchlist, how I score each chart, and what causes me to remove a stock before it ever becomes a trade.
Educational disclaimer: This article shares my personal workflow for educational and experimental purposes. It is not financial advice or a recommendation to buy, sell, or hold any security. Every strategy involves risk, and past chart behavior does not guarantee future results.
What Is a Renko Watchlist?
A Renko watchlist is a focused list of stocks, exchange-traded funds, currencies, or other markets that I want to monitor using Renko charts.
It is not a list of stocks I plan to buy. It is also not a collection of automatic trade signals. A symbol can qualify for my watchlist without being anywhere close to an entry.
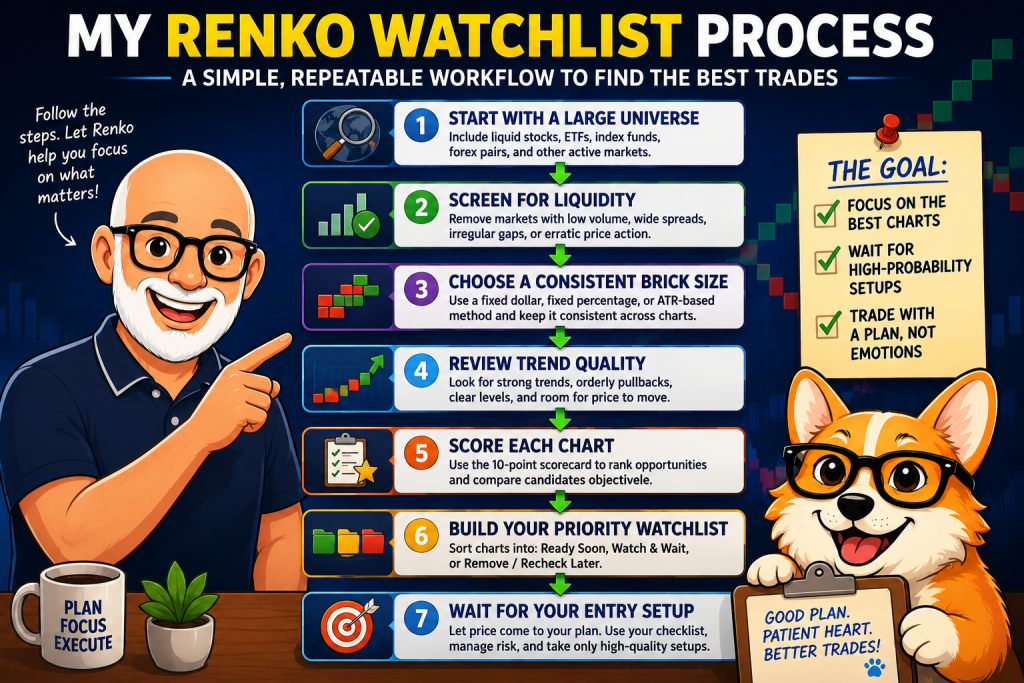
I think of the watchlist as the first filter in a larger Renko trading process:
- Start with a broad group of liquid markets.
- Remove charts that do not fit my basic requirements.
- Identify clean trends and developing setups.
- Score and prioritize the remaining charts.
- Wait for a specific entry condition.
- Apply my trade checklist, risk rules, and position-sizing process.
This separation is important. Building a watchlist and approving an actual trade are two different decisions.
For a broader look at how I connect market selection, entries, risk management, and exits, see how I build a complete Renko trading system.
Why I Use Renko Charts to Build My Watchlist
Traditional candlestick charts organize price movement by time. Renko charts focus primarily on price movement and create a new brick only after price moves by the required amount.
That structure helps me compare charts without becoming distracted by every small intraday fluctuation. I can focus on several practical questions:
- Is the market trending or moving sideways?
- Are pullbacks orderly or erratic?
- Does the chart frequently reverse after only one or two bricks?
- Is price approaching a recognizable support or resistance area?
- Is the trend already extended?
TradingView explains that Renko charts are constructed from bricks determined by price fluctuations rather than ordinary time-based bars. Its official guide also explains the available brick-calculation methods and chart settings. You can review the TradingView Renko chart documentation for additional platform-specific details.
Renko charts do not tell me what will happen next. They give me a consistent visual framework for deciding which markets deserve additional attention.
Step 1: Start With Markets That Work Well With Renko Charts
I do not begin by opening random ticker symbols. I start with a defined universe of securities that generally have enough trading activity and price movement to produce usable Renko charts.
My starting universe may include:
- Large and actively traded stocks
- Broad-market ETFs
- Sector ETFs
- Major index-tracking funds
- Actively traded currency pairs
- Highly liquid cryptocurrencies, when appropriate for the strategy
I am not suggesting that every large stock or ETF automatically produces a good Renko setup. This is only the starting pool from which I build a smaller list.
I discuss the characteristics I look for in more detail in best stocks for Renko trading and best markets for Renko charts.
Step 2: Remove Stocks With Poor Liquidity
Renko charts may filter smaller price movements, but they do not solve liquidity problems.
Investor.gov defines liquidity as how easily or quickly a security can be bought or sold in a secondary market. You can read its explanation of liquidity and marketability.
When reviewing a stock for my watchlist, I pay attention to:
- Average trading volume
- Bid-ask spread
- Frequency of irregular price gaps
- Consistency of price movement
- Whether orders can reasonably be entered and exited
The bid-ask spread is the difference between the highest price a buyer is willing to pay and the lowest price at which a seller is willing to sell. FINRA discusses this trading cost in its guide to exchange-traded funds and products.
A wide spread can make an apparent chart opportunity less attractive. The Renko setup may look clean, but entering and exiting the position could be more expensive or difficult than the chart suggests.
Liquidity Warning Signs
- Very low or inconsistent volume
- A noticeably wide bid-ask spread
- Long periods with little meaningful price activity
- Frequent and unpredictable gaps
- Erratic brick sequences that do not form a readable structure
- Large price reactions to relatively minor news
If a stock repeatedly shows these characteristics, I usually remove it before spending time evaluating indicators or entry signals.
Step 3: Apply a Consistent Renko Brick-Size Method
A watchlist comparison is only useful when I apply my chart settings consistently.
If I keep changing brick sizes until every stock displays a beautiful trend, I am no longer screening the charts objectively. I am adjusting the evidence to produce the picture I want to see.
Depending on the experiment, I may use:
- A fixed dollar brick size
- A fixed percentage-based method
- An ATR-based brick size
- A previously backtested setting for a particular market
The purpose of this article is not to declare one method universally superior. The important point is consistency. Each chart should be evaluated using a logical brick-size process rather than a setting selected only because it makes the historical chart look attractive.
These guides provide more detail:
- How to choose the best Renko brick size
- ATR-based Renko brick-size calculation
- Renko brick-size backtesting in TradingView
- Best Renko chart settings for TradingView
Step 4: Look for Clean Renko Trend Structure
After filtering for market quality and applying a consistent brick size, I evaluate the chart’s structure.
I am not searching for a perfect chart. Perfect historical trends are easy to recognize after they have happened. I am looking for price behavior that can be evaluated with clear and repeatable rules.
Characteristics I Prefer
- Sustained sequences of bricks moving in the same direction
- Pullbacks that do not immediately destroy the larger trend
- Limited back-and-forth reversals
- Clearly visible support or resistance areas
- Enough price movement to create practical entry and exit levels
- Room for price to move before encountering a major barrier
Characteristics I Treat Cautiously
- Repeated one-brick or two-brick reversals
- A trend that has already moved far from its recent base
- Price trapped between nearby support and resistance
- A setup requiring an unusually wide stop
- A chart that only looks tradable after adding several indicators
For additional examples of market structure, see my guide to Renko support and resistance and my article about avoiding Renko false signals.
Step 5: Score Each Renko Chart
Once a chart passes my initial filters, I score it. The score does not predict whether the trade will make money. It gives me a consistent way to compare several candidates.
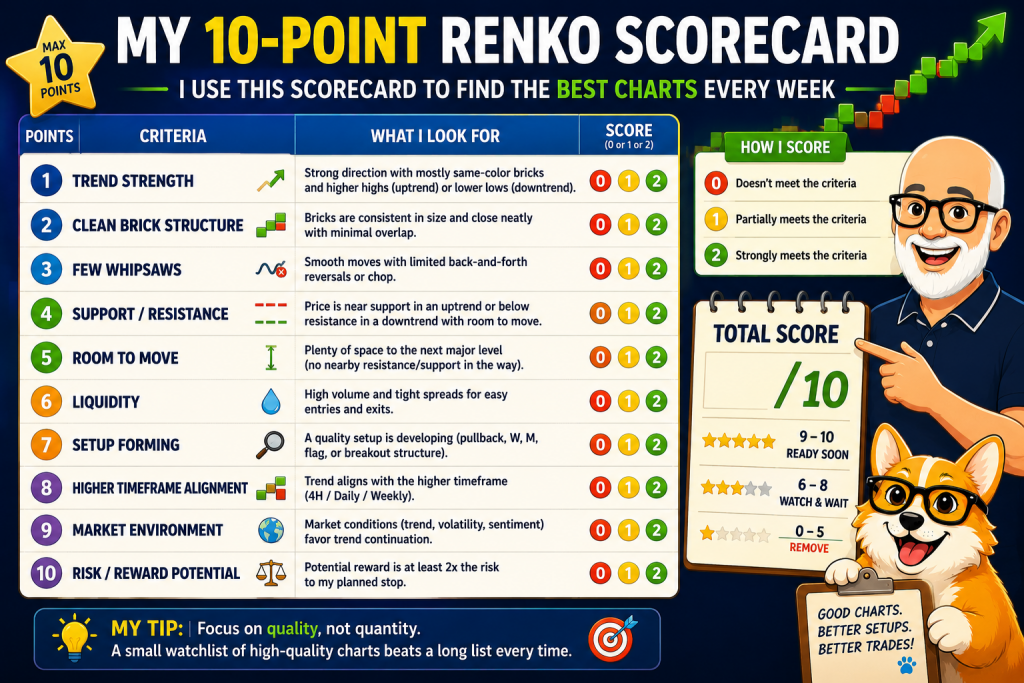
| Watchlist criterion | Possible points |
|---|---|
| Strong and visible trend | 0 to 2 |
| Clean brick formation | 0 to 2 |
| Limited recent whipsaws | 0 to 2 |
| Clear support or resistance | 0 to 1 |
| Room for a meaningful price move | 0 to 1 |
| Acceptable liquidity and spread | 0 to 1 |
| Setup is forming without appearing overextended | 0 to 1 |
| Maximum score | 10 |
How I Interpret the Score
| Score | Watchlist decision |
|---|---|
| 8 to 10 | Priority candidate |
| 6 to 7 | Secondary candidate |
| 4 to 5 | Needs improvement before receiving more attention |
| 0 to 3 | Remove or recheck later |
The scoring process helps prevent me from choosing a chart only because I like the company, recognize the ticker, or recently heard an exciting story about it.
This watchlist score is different from my Renko trade setup checklist. The watchlist score identifies charts worth monitoring. The trade checklist evaluates a specific setup before I consider entering.
Step 6: Divide the Watchlist Into Three Groups
A watchlist becomes difficult to use when every ticker receives the same priority. I divide mine into three groups.
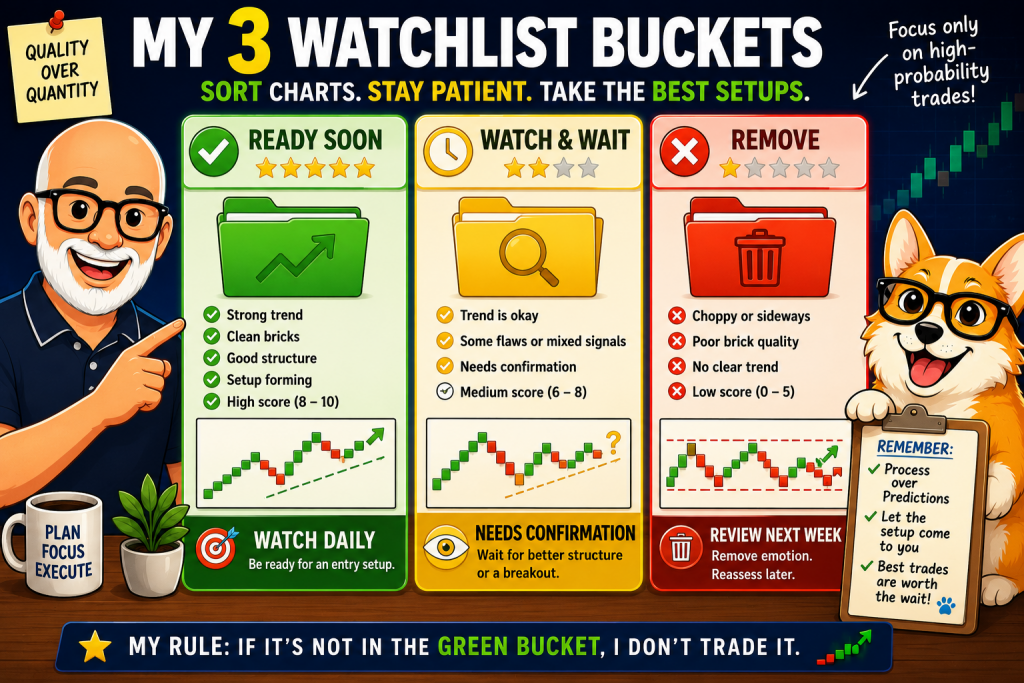
Group 1: Ready Soon
These are higher-scoring charts with a developing setup near a possible decision point.
A stock in this group might be:
- Approaching a pullback area
- Testing support or resistance
- Waiting for a confirmed Renko reversal
- Near a potential trend continuation level
Ready soon does not mean buy now. It means the chart deserves closer observation because one of my defined conditions may develop.
Group 2: Watch and Wait
These charts have promising characteristics, but the setup is incomplete.
I may be waiting for:
- A deeper pullback
- A breakout above resistance
- A clearer trend sequence
- Reduced volatility
- Confirmation that a reversal is more than a temporary reaction
Group 3: Remove or Recheck Later
These charts no longer meet my current requirements.
I do not need to declare that the stock is permanently untradable. I only need to recognize that it does not deserve space on my active watchlist right now.
Step 7: Define the Setup Before the Trade Appears
A ticker symbol alone does not tell me why a stock is on my watchlist. For every serious candidate, I record the condition I am waiting for.
My notes may include:
- Current Renko trend
- Brick size and calculation method
- Reason the chart qualified
- Potential entry condition
- Nearby support or resistance
- Potential invalidation level
- Reason the symbol should be removed
- Relevant earnings or event date
Writing down the setup before it happens reduces the temptation to invent a new reason for entering after price begins moving.
My Weekly Renko Watchlist Routine
I do not need to rebuild the entire list every day. A scheduled review keeps the process manageable and helps me avoid constant chart-checking.
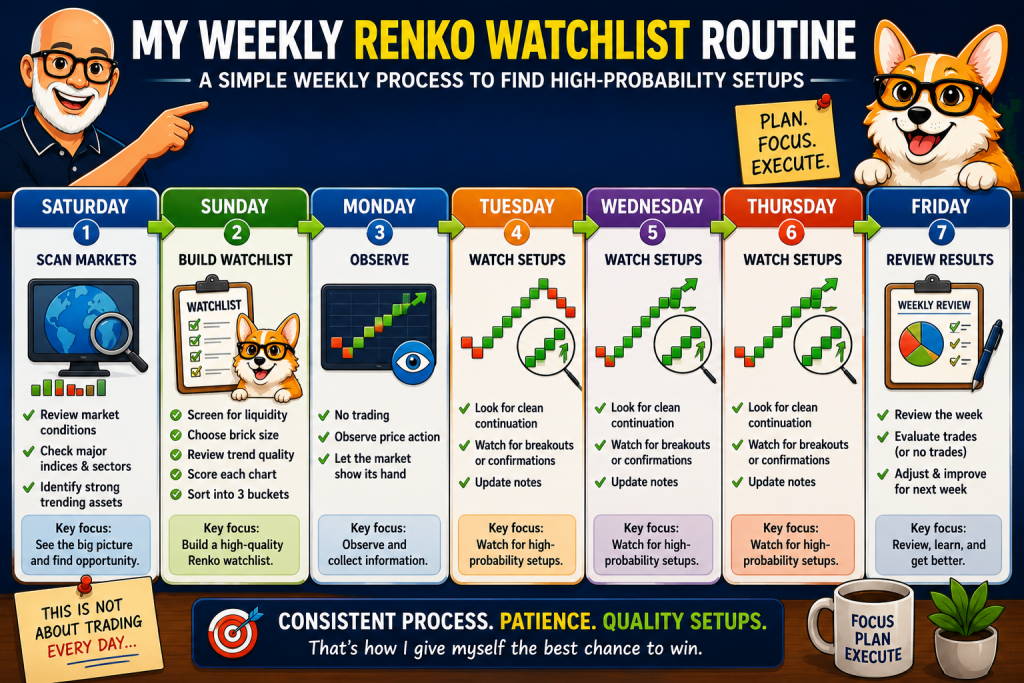
| Time | Watchlist activity |
|---|---|
| Weekend | Scan the larger group of stocks, ETFs, or other markets. |
| Sunday evening | Review Renko structure, score the charts, and create the priority list. |
| Monday | Observe how markets begin the week before making major watchlist changes. |
| Tuesday through Thursday | Monitor whether defined setups develop or become invalid. |
| Friday | Review outcomes, remove weak charts, and record lessons for the next scan. |
This schedule is only an example. A day trader, swing trader, and long-term investor may review charts at different intervals. The important part is having a routine rather than reacting to every new price movement.
What Makes Me Remove a Stock From the Watchlist?
Removing stocks is as important as adding them. Without removal rules, a watchlist becomes a storage area for old ideas that no longer have a purpose.
I may remove a symbol when:
- The trend structure breaks down.
- The chart develops repeated reversals and whipsaws.
- Price becomes too extended from a reasonable entry area.
- The original support or resistance idea is no longer valid.
- The potential stop distance becomes too large.
- The expected reward no longer justifies the risk.
- An earnings announcement or major event creates risk I do not want to accept.
- Liquidity deteriorates or the spread becomes unattractive.
- Better and clearer candidates become available.
A stock can always be reconsidered during a future scan. Removing it from the active list does not require predicting that it will perform poorly.
Example Renko Watchlist Template
The following table shows how a simple Renko watchlist could be organized. The symbols and values are illustrative examples only. They are not current trade recommendations.
| Symbol | Market | Brick size | Trend | Score | Setup needed | Invalidation | Status |
|---|---|---|---|---|---|---|---|
| AAPL | Stock | $2.00 | Up | 8 | Orderly pullback and bullish reversal | Break below identified support | Ready soon |
| SPY | ETF | $5.00 | Up | 7 | Confirmed resistance breakout | Trend reversal below support | Watch and wait |
| EURUSD | Forex | 20 pips | Sideways | 4 | New directional trend sequence | Continued back-and-forth bricks | Recheck later |
A spreadsheet can include additional columns for earnings dates, sector, average volume, entry level, stop distance, position size, and personal notes.
How Many Stocks Should Be on a Renko Watchlist?
There is no universal number that works for everyone. The list needs to be small enough that I can review each chart carefully without becoming overwhelmed.
A list of 50 symbols may look thorough, but it is not useful if I cannot remember why most of them are included. A smaller group with written conditions is often more actionable than a large collection of unorganized tickers.
One practical approach is to maintain:
- A broad scanning universe
- A smaller watch-and-wait list
- A very small priority list
For example, I might scan dozens of charts but keep only a few in the ready-soon category. The exact numbers depend on the market, strategy, and amount of time available for monitoring.
Should I Diversify the Watchlist?
A watchlist containing several symbols does not automatically provide meaningful diversification. Five technology stocks, for example, may react similarly to the same market event.
Depending on the strategy, I may group candidates by:
- Sector
- Industry
- Asset class
- Market capitalization
- Volatility profile
- Correlation with existing positions
Investor.gov describes diversification as spreading money among different investments to reduce concentration risk. Its asset allocation and diversification guide provides a useful overview.
Diversification cannot guarantee gains or prevent losses. It is one factor to consider when a watchlist eventually leads to multiple open positions.
Common Renko Watchlist Mistakes
1. Adding Too Many Stocks
A watchlist should reduce distraction. Adding every stock with one attractive trend defeats that purpose.
2. Changing Brick Sizes to Improve the Chart
Repeatedly adjusting the brick size until a messy chart becomes smooth can create a misleading comparison. I prefer to decide how brick size will be selected before evaluating the trend.
3. Treating Every Watchlist Stock as a Trade
The watchlist identifies possibilities. A separate entry condition must still occur before the symbol becomes a potential trade.
4. Ignoring Liquidity and Trading Costs
A clean chart does not eliminate spreads, slippage, commissions, taxes, or other real-world considerations.
5. Chasing an Extended Trend
A long sequence of bricks may demonstrate strength, but it may also mean that the lower-risk entry occurred several bricks earlier. I do not assume that a strong trend is automatically a timely entry.
6. Keeping Stale Ideas Indefinitely
Every candidate should have a reason for remaining on the list. When that reason disappears, I remove the symbol or move it to a lower-priority group.
7. Using Too Many Indicators
A watchlist scan should be efficient. If I need five indicators and several exceptions to justify a chart, the setup may not be as clear as I want it to be.
For a streamlined discussion of indicator selection, see best indicators for Renko charts in TradingView.
8. Scanning Without Written Rules
Without written rules, my selection criteria can change from one chart to the next. A scorecard gives me a simple structure for keeping the review consistent.
How the Watchlist Fits Into My Complete Renko Process
The watchlist is only the beginning. A complete workflow requires several decisions after a chart qualifies.
- Select the market universe. Begin with stocks, ETFs, or other instruments that fit the strategy.
- Build the Renko watchlist. Filter for liquidity, readable structure, and suitable price movement.
- Wait for a defined setup. Do not enter simply because a stock appears on the list.
- Apply the trade checklist. Evaluate the entry, trend, confirmation, and invalidation conditions.
- Define the risk. Decide how much of the account can be lost if the idea fails.
- Calculate position size. Connect the allowed risk to the stop distance.
- Manage the position. Follow predetermined stop, exit, and adjustment rules.
- Review the outcome. Record what happened and whether the process was followed.
The following guides cover the later stages of that workflow:
- Renko trade setup checklist
- Early versus confirmed Renko entries
- Renko risk management strategy
- Renko position sizing
- Renko stop-loss and take-profit methods
- Renko chart exit rules
Frequently Asked Questions
How do I build a Renko watchlist?
Start with liquid stocks or markets, apply a consistent Renko brick-size method, and remove charts with erratic price movement. Score the remaining candidates based on trend quality, recent whipsaws, support and resistance, liquidity, and available room for price to move. Separate the final list into priority, watch-and-wait, and remove categories.
Is a Renko watchlist a list of buy signals?
No. A Renko watchlist is a list of charts worth monitoring. A separate entry condition, risk review, and position-sizing decision should occur before any trade is considered.
How often should I update a Renko watchlist?
The review schedule depends on the strategy. A swing trader may perform a larger scan on the weekend and shorter reviews during the week. A long-term investor may update the list less frequently, while an active trader may review it daily.
Should every stock use the same Renko brick size?
Not necessarily. Stocks at different prices and volatility levels may require different brick sizes. However, the method used to select those sizes should remain consistent. Changing settings only to make individual charts look better can undermine the screening process.
What makes a stock suitable for a Renko watchlist?
I prefer sufficient liquidity, manageable spreads, meaningful price movement, readable trend structure, limited whipsaws, and identifiable decision levels. A suitable chart still needs a valid setup before it becomes a possible trade.
Can I build a Renko watchlist with ETFs?
Yes. Broad-market and sector ETFs can be included when they meet the liquidity, price movement, brick-size, and trend-structure requirements of the strategy. ETF shares are still subject to risks and trading costs, including bid-ask spreads.
Final Thoughts: A Better Watchlist Can Lead to Fewer Trades
The purpose of my Renko watchlist is not to generate as many trades as possible. It is to reduce random decisions and focus my attention on charts that meet predefined conditions.
A good watchlist helps me answer three questions:
- Which charts deserve my attention?
- What specific condition am I waiting for?
- What would cause me to remove the idea?
By filtering for liquidity, using consistent brick-size rules, scoring trend quality, and separating candidates by priority, I can spend less time jumping between random charts and more time waiting for clearly defined setups.
That does not guarantee profitable trades. It gives me a more organized and repeatable process for deciding where to focus next.
Important: Renko charts, technical indicators, watchlists, and backtests cannot predict future market performance. The examples in this article are educational ideas, not financial advice. Always conduct your own research and evaluate the risks before making an investment or trading decision.