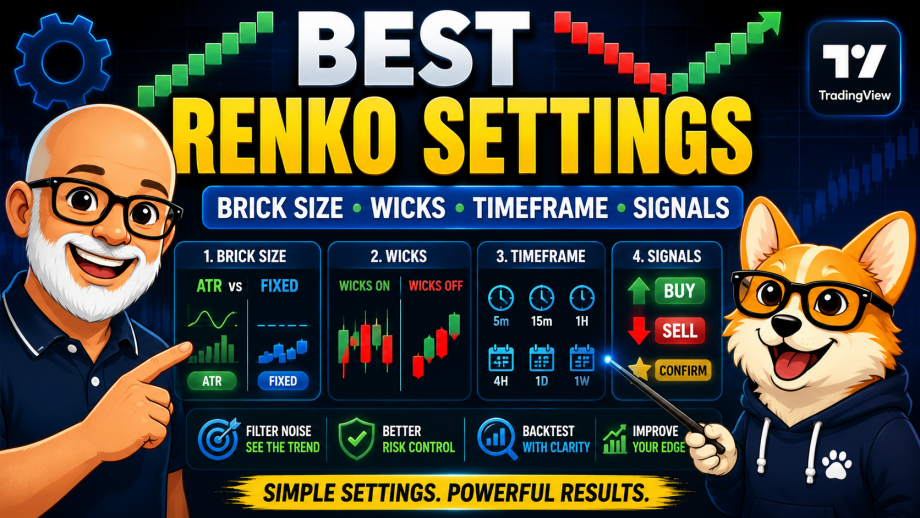
Finding the best Renko chart settings can feel confusing at first. Should you use ATR or a fixed brick size? Should wicks be turned on? Does the timeframe matter? And how do you know when your Renko chart is filtering noise instead of hiding useful price action?
In this guide, I’ll walk through a practical way to set up Renko charts in TradingView so you can test ideas more clearly. This is not about finding one magical setting. It is about building a repeatable setup that helps you compare strategies, reduce noise, and avoid changing your chart every time the market gets choppy.
For TradingView’s official explanation of Renko chart options, you can also review their help page: Understanding Renko Charts on TradingView.
Important: This article is for education and experimentation only. It is not financial advice. Always test any trading idea carefully before risking real money.
What Do Renko Chart Settings Actually Control?
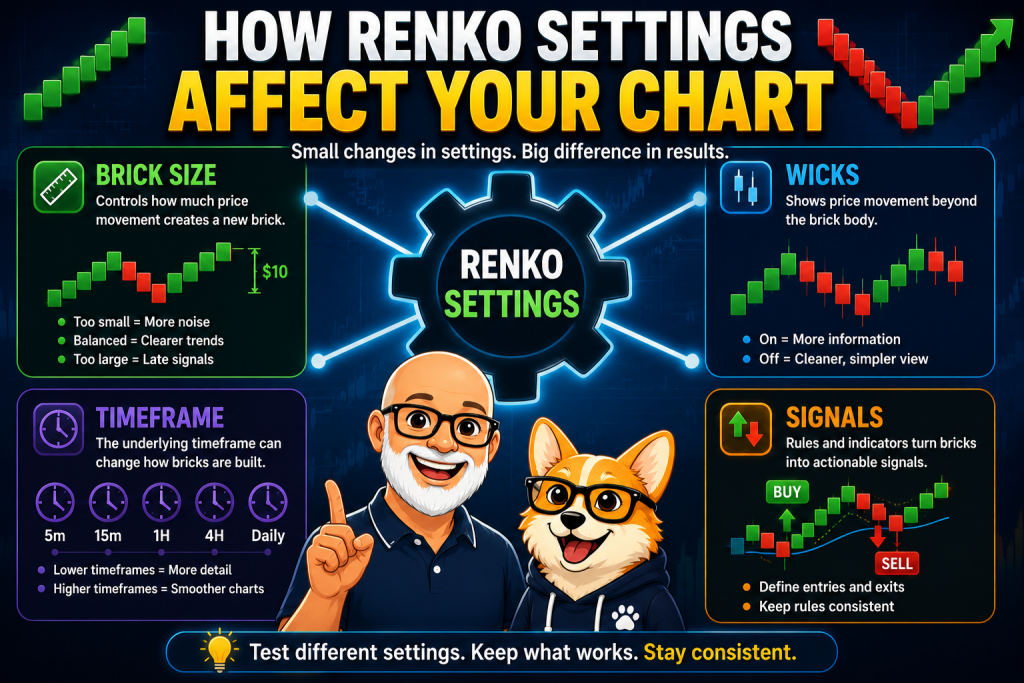
Renko charts are built from price movement instead of regular time intervals. A new brick appears only after price moves a certain amount. That brick size is the most important Renko setting because it controls how much market movement is needed before the chart updates.
In TradingView, your Renko setup usually comes down to a few key choices:
- Brick size: How large each Renko brick should be.
- ATR or fixed brick size: Whether the brick size adjusts based on volatility or stays the same.
- Timeframe: The underlying chart timeframe used by TradingView.
- Wicks: Whether the chart shows price movement beyond the brick body.
- Reversal behavior: How you interpret trend changes and opposite-color bricks.
- Indicators: Moving averages, Supertrend, RSI, MACD, or other tools layered on top.
The goal is not to make the chart look perfect. The goal is to create a setup you can test consistently.
ATR vs Fixed Brick Size: Which Renko Setting Should You Use?
The first big decision is whether to use an ATR-based brick size or a fixed brick size.
ATR-Based Renko Brick Size
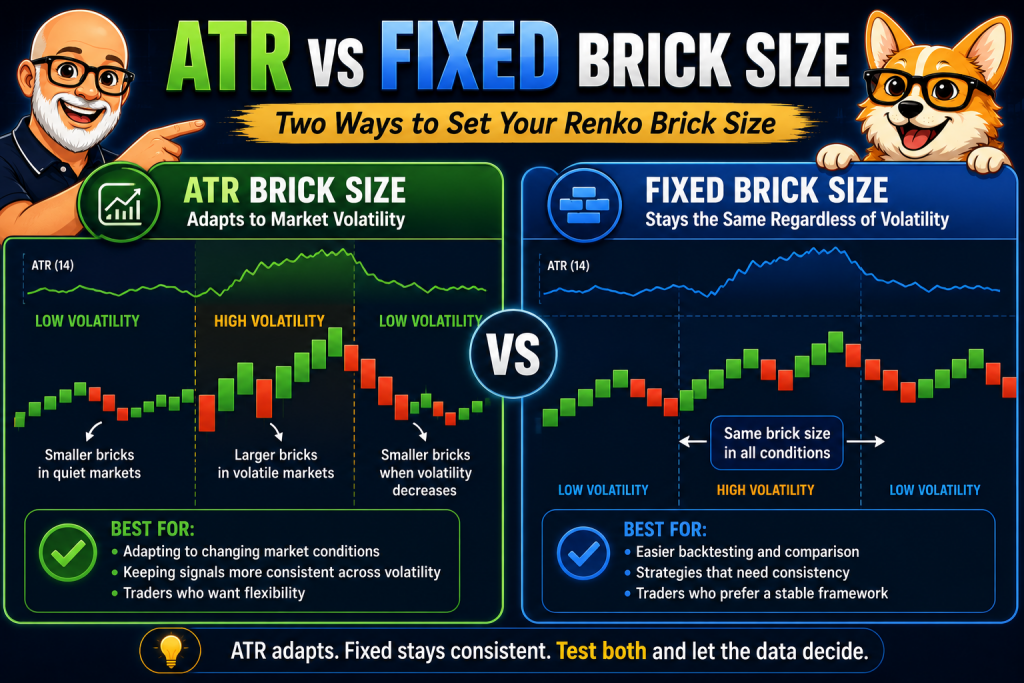
ATR stands for Average True Range. An ATR-based Renko chart adjusts the brick size based on recent volatility. When volatility increases, the brick size may get larger. When volatility decreases, the brick size may get smaller.
This can be useful when you want your chart to adapt to changing market conditions. However, it can also make strategy testing harder because the brick size is not always constant over time.
For a deeper explanation, you can link to your ATR article here:
ATR-Based Renko Chart Brick Size Calculation: Proven Tips and Tricks
Fixed Renko Brick Size
A fixed brick size stays the same unless you manually change it. For example, you might test a $2 brick size on AAPL, a 50-point brick size on an index, or a 100-pip brick size on a forex pair.
Fixed brick sizes are easier to compare in backtesting because the rule stays consistent. If you are testing a strategy in TradingView, fixed brick sizes can make your results easier to understand.
My Practical Preference
For strategy development, I usually prefer starting with a fixed brick size because it gives me a cleaner testing environment. Then I may compare that result against ATR-based Renko later.
A simple workflow looks like this:
- Pick one market.
- Choose one fixed brick size.
- Run the backtest.
- Change only one setting at a time.
- Compare the results.
How to Choose a Starting Renko Brick Size
There is no single best brick size for every trader or every market. A small brick size creates more signals, but also more noise. A larger brick size filters more noise, but it may enter later and exit later.
Here is a simple way to think about it:
| Brick Size | Potential Benefit | Potential Drawback |
|---|---|---|
| Small | More entries and quicker signals | More false signals and whipsaws |
| Medium | Balanced trend visibility | May still need confirmation |
| Large | Cleaner trends and less noise | Later entries and wider stops |
If you are new to Renko, start with a brick size that makes the chart readable. If every small price move creates a new brick, the chart may be too sensitive. If the chart barely moves, the brick size may be too large. The stock you choose can also have a major impact on chart behavior. Highly liquid stocks with strong trends often produce cleaner Renko charts than thinly traded stocks. See my guide to the best stocks for Renko trading for examples.
You can support this section with an internal link here:
How to Choose the Best Renko Brick Size
Does the Timeframe Matter on Renko Charts?
Yes, the timeframe can still matter in TradingView, even though Renko charts are based on price movement. The underlying timeframe can affect how Renko bricks are built, especially during backtesting and historical chart calculations.
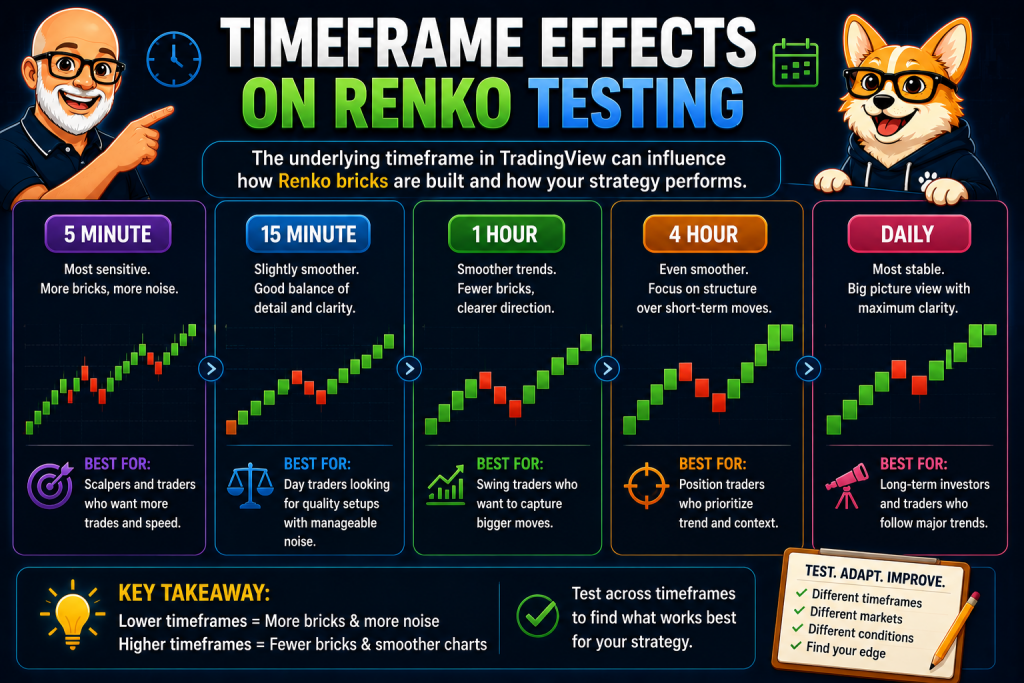
This is one reason two traders can use the same brick size and still see slightly different results. The chart source, timeframe, session settings, and data provider may all affect the final Renko display.
For practical testing, I like to keep the timeframe consistent. For example, do not test one strategy on a daily Renko chart and then compare it to another result using a 5-minute base chart unless that is part of your experiment.
You can link to your timeframe article here:
Best Timeframe for Renko Charts
Should You Use Wicks on Renko Charts?
Renko wicks can show price movement that happened beyond the brick body before the brick closed. Some traders like wicks because they reveal extra information. Others prefer clean bricks because they want a simpler trend view.
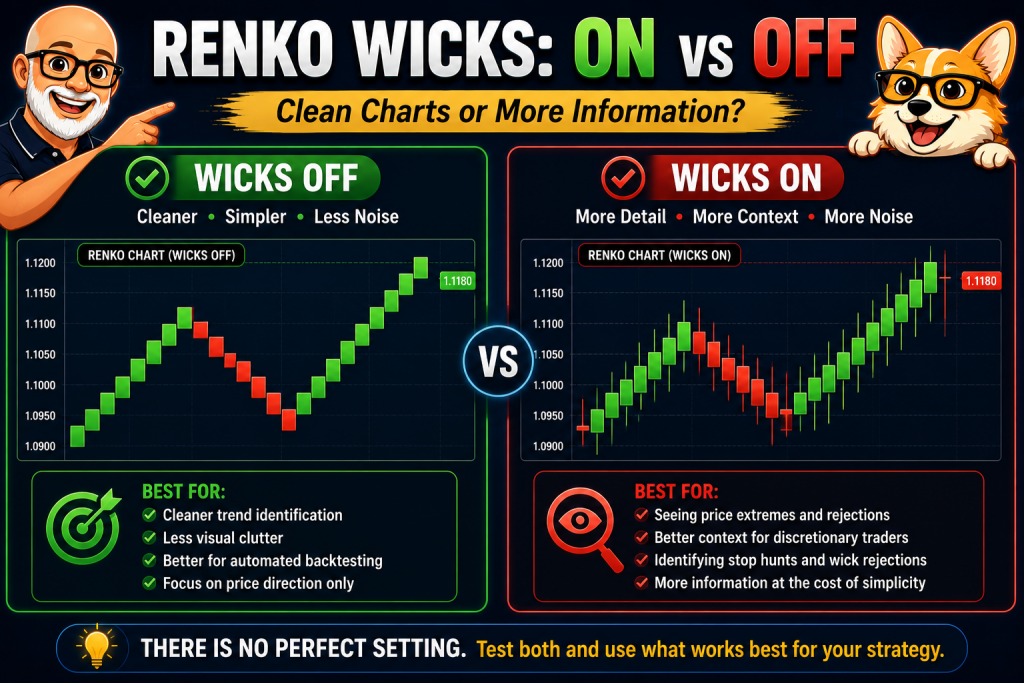
Here is how I think about it:
- Use wicks if you want to see rejection, failed moves, or deeper pullbacks.
- Turn wicks off if you want a cleaner chart focused only on completed Renko bricks.
- Test both if your strategy depends on entries, exits, or stops near recent highs and lows.
Wicks can be helpful for stop placement, but they can also make the chart feel more complicated. If you are just starting, test your strategy with wicks off first. Then turn them on and see whether they improve your decisions.
Suggested internal link:
Renko Brick Size, Wicks, and Reversal Confirmation
Renko Reversal Rules: When Has the Trend Actually Changed?
One of the biggest mistakes with Renko charts is assuming that every opposite-color brick is a major trend change. Sometimes it is. Sometimes it is just a pullback.
A practical Renko reversal rule should answer three questions:
- How many opposite bricks do I need before I consider the trend reversed?
- Do I need confirmation from an indicator?
- Where will I exit if the reversal fails?
For example, a basic trend-following idea might wait for two bricks in the opposite direction before exiting. A more aggressive strategy might exit on the first opposite brick. A more conservative strategy might wait for a moving average break, Supertrend flip, or support and resistance failure.
The key is to define the rule before the trade. If you change your reversal rule after every losing trade, your backtest becomes less useful.
Best Indicators to Pair With Renko Settings
Renko charts already filter some market noise, so I usually avoid loading the chart with too many indicators. A simple setup is often easier to test and easier to trust.
Some useful indicators to test with Renko include:
- Moving averages: Useful for trend direction and pullback confirmation.
- Supertrend: Helpful for trend-following entries and exits.
- RSI: Useful for momentum or overextended conditions.
- MACD: Useful for momentum shifts and confirmation.
- Support and resistance: Useful for filtering weak signals.
My preferred starting point is simple: one trend filter and one entry rule. For example, you might use Renko bricks with a moving average, then test whether signals perform better above or below that moving average.
Good internal links for this section:
- How to Use Moving Averages With Renko Charts
- Renko Supertrend Strategy Explained
- Best Indicators for Renko Charts in TradingView
Best Renko Chart Settings for Brick Size, Wicks, and Timeframe
If I were starting a fresh Renko experiment in TradingView, I would keep the first version simple. The goal is to build a baseline, not to create the final perfect system on the first try.
| Setting | Starter Choice | Why |
|---|---|---|
| Brick Type | Fixed brick size | Easier to compare in backtesting |
| Brick Size | Medium relative to the market | Balances noise and signal frequency |
| Wicks | Off first, then test on | Keeps the first test cleaner |
| Timeframe | Keep consistent | Improves comparison between tests |
| Trend Filter | Moving average or Supertrend | Simple confirmation |
| Exit Rule | Opposite brick or indicator flip | Easy to define and test |
Once that baseline is built, test variations one at a time. Change the brick size, then test. Change the wick setting, then test. Change the exit rule, then test. This makes it easier to see which setting actually helped.
Common Renko Settings Mistakes
Renko charts can look clean, but that does not automatically make them easy to trade. Here are some mistakes I try to avoid:
- Changing the brick size after every losing trade. This can lead to curve fitting.
- Using a brick size that is too small. This can create too many whipsaws.
- Using a brick size that is too large. This can make entries and exits too late.
- Ignoring stop loss placement. Clean charts still need risk management.
- Testing too many indicators at once. This makes it hard to know what is helping.
- Comparing different settings unfairly. Keep the market, date range, and rules consistent.
If you are struggling with false signals, this article can support the next step:
Renko Chart False Signals: How to Avoid Them
Backtesting Your Renko Settings
Backtesting is where Renko settings become more useful. A chart may look great visually, but the numbers may tell a different story. Before trusting any setup, test it over different market conditions.
At minimum, I like to review:
- Total return
- Maximum drawdown
- Win rate
- Profit factor
- Number of trades
- Average trade
- Comparison to buy and hold
A Renko setup that makes fewer trades and reduces drawdown may be more useful than one that only chases the highest return. It depends on your goal.
Suggested internal links:
- Backtesting Renko Chart Strategies: Tips and Techniques
- Renko Brick Size Backtesting in TradingView
- Does Renko Beat Buy and Hold?
My Simple Renko Settings Checklist
Before I start testing a Renko strategy, I want to answer these questions:
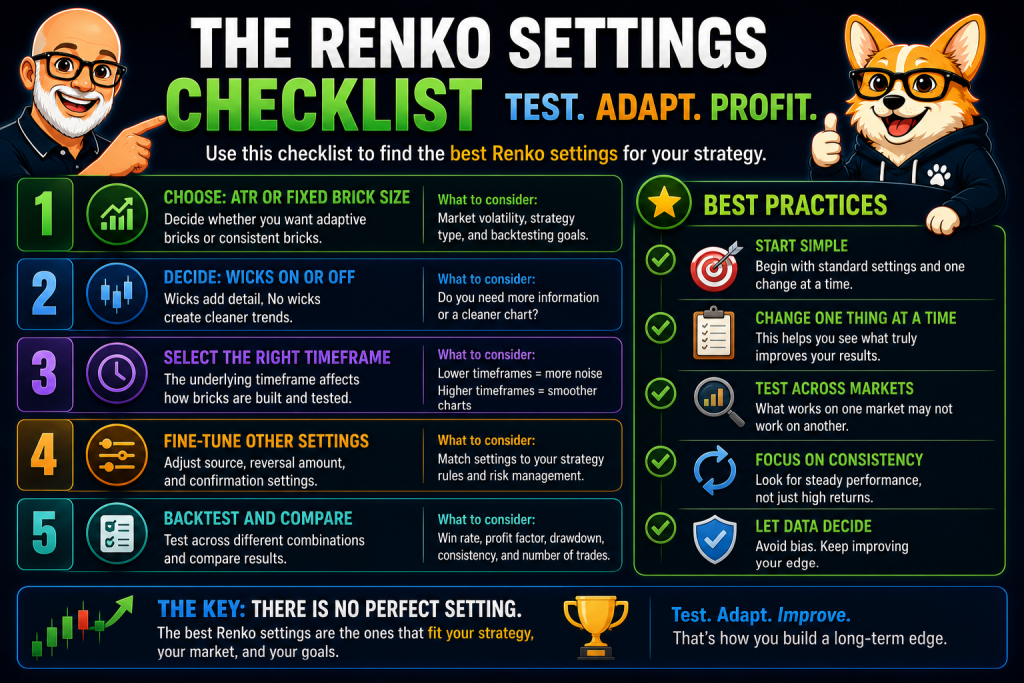
- What market am I testing?
- What date range am I using?
- Am I using ATR or fixed brick size?
- What exact brick size am I testing?
- Are wicks on or off?
- What timeframe or base chart am I using?
- What confirms an entry?
- What confirms an exit?
- Where is the stop loss?
- What benchmark am I comparing against?
If you cannot answer those questions, the test may not be ready yet. Clear settings create clearer results.
Final Thoughts: The Best Renko Settings Are the Ones You Can Test
The best Renko chart settings are not always the ones that look best on a screenshot. They are the settings you can define, test, compare, and repeat.
For TradingView, I would start with a fixed brick size, keep the chart clean, test wicks separately, use one simple trend filter, and define your exit rule before entering a trade. Then compare the results against other settings and against buy and hold.
Renko charts can be a powerful way to simplify price action, but they still require discipline, testing, and risk management. Treat every setup as an experiment first.
Educational reminder: These Renko settings are trading ideas for research and learning. They are not financial advice or a recommendation to buy or sell any security.