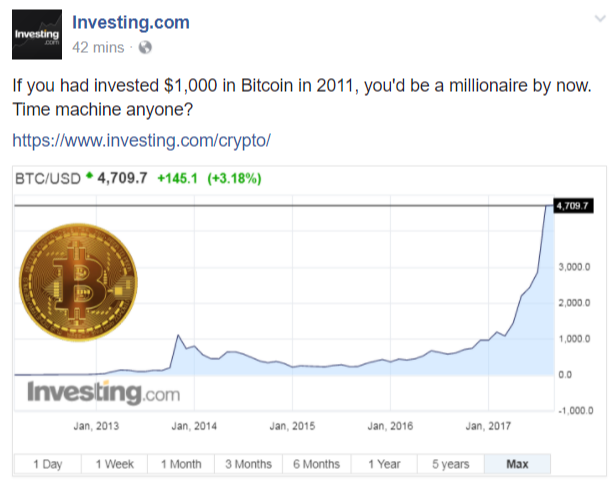
According to invest.com, you could have become a millionaire in merely 6 years with an initial and only investment of $1,000.
Related Posts
SP 500 Renko Chart Trading and Technical Analysis 7/30/21
Overview Renko Chart Trading On Friday, the SP 500 FUTURES did not reach a new all-time high. The record high of 4,422 was maintained, and the consolidation pattern persisted. It traded in a narrow range between 4,370 and 4,405 all day on Friday. The daily Renko chart trading pattern plainly…
Investment: How to Take a Holistic Approach – 1
Why is Holistic Financial and Investment Planning Important? A pandemic changes the way people invest. For some, this means putting their money into assets that are safer. For others, it means rethinking how they decide how much risk to take. Others have to wait for the market to settle down….
Your Wallet May Not Like This: Expect to Pay More at the Pumps
Crude oil prices soared after Saudi Arabia and Iran were getting closer to war. In addition, Saudi Arabia crown prince ordered a sudden purge of the elites. We can expect to pay more at the pumps. With a 10-cent per gallon jump, for instance, it will cost about $1.30 more…
