Skip to content
Lacois: Passive Income and Renko Charts: A Blog for Investors

Master precision trading with Renko charts. Combine them with covered calls & DRIPs for passive income. Unlock financial freedom through strategic insights.

  • LACOIS 🌈
  • Renko Chart Basics
    • Chart Comparison
      • Heikin Ashi vs. Renko vs. Candlestick Charts: Unleashing Explosive Profits
      • Renko vs. Traditional Charts: 3 Winning Insights for Trading Success
      • Mastering Heikin Ashi for Optimal Trading: 10 Proven Power Moves
    • Renko Brick Size Calculation
    • Renko Chart Patterns
    • Renko Chart Indicators
    • Renko Trading Platforms
  • Renko Chart Strategies
    • Renko Trading Strategy and Signals – a How to Guide
    • Advanced Renko Chart Strategies for Experienced Traders
    • Supercharge Your Crypto Trading Accuracy: 5 Proven Renko Chart Strategies
    • Unlock the Secrets to Successful Renko Chart Trading with These Proven Tips
  • Advanced Renko Strategies
    • Renko Swing Trading
    • Renko Day Trading
    • Renko Scalping
    • Renko Crypto Trading
    • Renko Backtesting
    • Heikin Ashi
  • Passive Income Strategies
    • Covered Calls
    • Dividend Stocks
    • ETFs
    • Retirement Planning
    • Budgeting
  • Market Forecast
    • SP 500 Outlook
    • NASDAQ Outlook
  • Extras
    • Side Hustles
    • Budgeting
    • Credit Card Strategy
    • Debt Management
    • Travel Hacking
  • Privacy Policy
  • About
Lacois: Passive Income and Renko Charts: A Blog for Investors

Master precision trading with Renko charts. Combine them with covered calls & DRIPs for passive income. Unlock financial freedom through strategic insights.

Nasdaq Is Now Officially Passing the 20% Gain Mark YTD

Posted on September 18, 2017 By rosered44

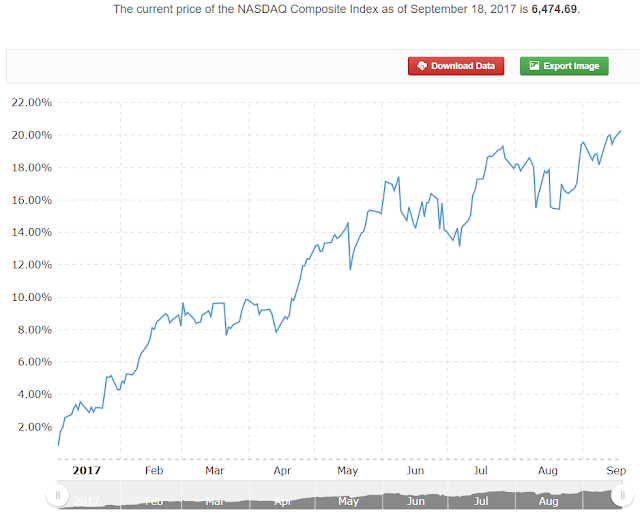
Powerhouse Nasdaq officially passed the 20% gain mark year to date today.

54762 Powerhouse Nasdaq officially passed the 20% gain mark year to date today.

If your 401(k) portfolio is tracking Nasdaq closely this year, your $500,000 nest egg could be worth $600,000 at this point.  Isn’t that great?

The experts and alike are still waiting for the correction that may not occur in 2017.   Do you think the stocks are overvalued at this point?
 

Invest

Post navigation

Previous post
Next post

Related Posts

Investment: How to Take a Holistic Approach – 1

Posted on August 30, 2022January 30, 2023

Why is Holistic Financial and Investment Planning Important? A pandemic changes the way people invest. For some, this means putting their money into assets that are safer. For others, it means rethinking how they decide how much risk to take. Others have to wait for the market to settle down….

Read More

SP 500 Renko Chart Trading and Technical Analysis 7/28/21

Posted on July 28, 2021August 27, 2023

Overview Renko Chart Trading For the past few days, the SP 500 FUTURES has been consolidating below the all-time high of 4,416. We noted on Monday that the index had climbed over 200 points in five days, indicating a strong V-shape comeback. As a result, it’s quite probable that the…

Read More

SP 500 Renko Chart Trading and Technical Analysis 9/7/21

Posted on September 7, 2021September 16, 2023

Overview Renko Chart Trading Today, the SP 500 FUTURES retreated somewhat. The all-time high is still 4,549. It hit a high of 4,548 during the day before reversing. The SP 500’s bullish trend is still very much intact, according to Renko chart trading patterns and technical analysis. The ascending trendline…

Read More

Leave a Reply Cancel reply

Your email address will not be published. Required fields are marked *

©2023 Lacois: Passive Income and Renko Charts: A Blog for Investors | WordPress Theme by SuperbThemes